The Midterms: A Microscope on Lower Merion
On November 6th 2018, the entire country (if not the entire world) witnessed a great shift in American politics. With 49 percent of eligible voters coming out to vote compared to 36.4 percent in the 2014 midterms elections, there is no doubt that people were paying attention to the political climate this year, not to mention the influx of online political participation through social media by voters and non-voters alike.
In short, two major outcomes were seen in November: (1) Republicans added a seat to their previous 52-seat majority in the Senate, and (2) the Democrats took control of the House of Representatives. Throughout the political community, neither of these outcomes were too surprising. Polls forecasted both correctly. However, there were many new patterns seen in voting demographics and patterns that many believe signify a new era of politics.
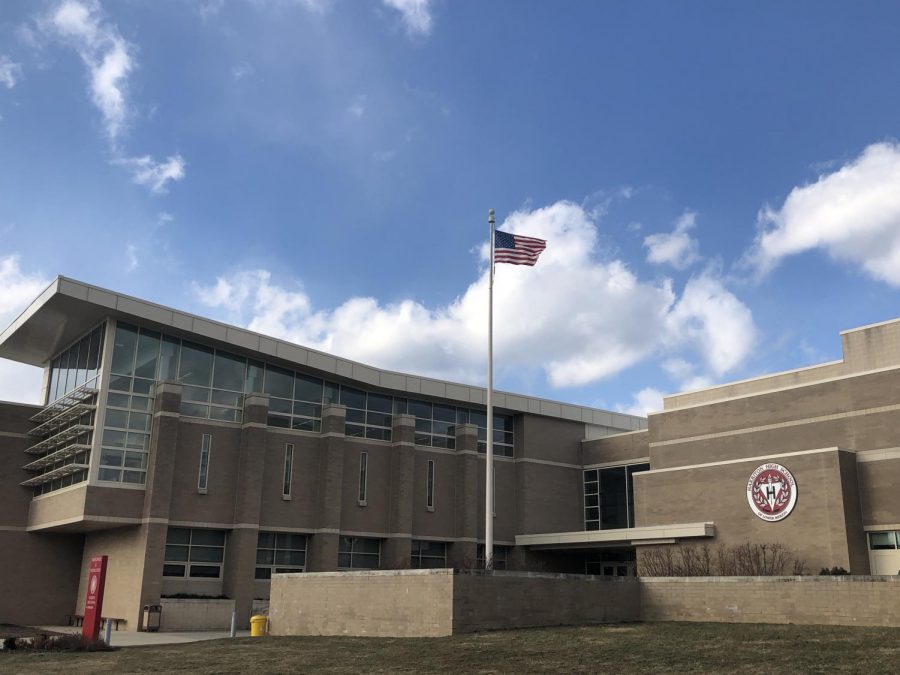
To observe these patterns in action, the Banner, in collaboration with Harriton TV, took to the polls on November 6th to get a raw sense of the mindset of voters in this year’s midterms. Reporters from Harriton spent the day outside of the Harriton High School polling center in the fourth congressional district to ask voters who they voted for and how they decided to vote in the elections.
To first address the limitations of the exit polling: due to the limited resources of the Banner and Harriton TV as well as the demographics of voters specific to the area, it was difficult to draw out definite patterns in voting behavior among different groups of voters on a large scale. However, it was quite easy to predict local voting patterns and likely voters in the area. We discovered a few such patterns among Lower Merion voters.
Compared to the rest of Pennsylvania, and America, Lower Merion voters heavily favored Democrats this time around. According to the official polling results from Harriton High School, roughly 70% of voters who voted straight ticket (all candidates from the same party) voted completely Democratic. Anyone who lives in Lower Merion wouldn’t find this too surprising given the largely liberal political climate.
However, it wasn’t necessarily the breakdown of party straight ticket ballots that surprised us, but rather, the amount of voters who voted straight ticket in comparison to previous elections.
In the Banner’s exit polling, respondents were asked how their decision on whether to vote straight ticket or independently in this election differed from their voting history in the past. The results were quite astounding: while approximately 81% of voters responded that they voted straight-ticket in this year’s midterm elections, a 57% majority of voters said that they do not usually vote straight-ticket in all elections. From our sample, this is about a 38% increase in voters who decided to vote straight ticket in this years elections.
With a margin so large, it is not just by chance that Lower Merion voters chose to vote strictly for one party over the other. With these results, we were able to come up with a few plausible explanations as to what may have motivated voters:
- Candidates from either party may have aligned very closely on most policies and run on similar party-oriented platforms. This would have led to voters aligning with all candidates relating to alike issues.
- Unlike previous elections, voters were overwhelmingly pleased or angered by certain parties on both the local and national level to such an extent that would lead them to support a certain party fully. A pattern frequently seen during midterm elections is that voters are often more skeptical of the recently elected president.
In general, local voters seemed happy at the prospect of improving their government. Commissioner Tiffany O’Neill, with whom we interacted throughout the day, noted the rising number of young voters coming out to the polls. In a country where young voter turnout has forever been struggling, this serves as a breath of fresh air.
However, we also observed crowds of voters, angry about one thing in particular: gerrymandering.
In each state, House congressional districts are drawn to encompass roughly equal numbers of people. However, in 2010 under Republican control, the borders of each district in Pennsylvania were redrawn. While these new districts stayed true to population, they were soon accused of being “aimed at achieving unfair partisan gain.”
In short, these districts were split in observation of heavily Democratic or Republican areas in order to give Republican candidates a leg up in congressional races. In 2012, Democrats won 51 percent of the statewide popular U.S. House vote, but only 5 out of the state’s 18 House seats.
For a very long time, Pennsylvania’s congressional districts have been recognized as one of the most gerrymandered states in the country (though they were just redrawn by an indpendent commission for November’s elections).
Justifiably angered by the prominent impact of gerrymandering, many anti-gerrymandering groups could be seen at the polls in November. Although generally well mannered, some representatives from these groups were visibly ill-tempered, trying to get attention from a crowd that usually did not have enough time to give them.
The midterms are often a referendum about the president and the current administration. During midterm elections, the president’s party usually loses seats in Congress, and that pattern was true this November as well. A portion of people who identify as Republicans voted Democrat this year, and they may feel that their values do not line up with their party anymore.
As a result of the election of Donald Trump to the presidency in 2016, the Republican party has been pushed even farther to the right and away from its more moderate conservative roots. An anonymous individual wrote, “Things have to change. The last 2 years have been a disaster.”

Charisma Hasan '20 is ecstatic to be an executive editor and writer for her fourth and final year at The Harriton Banner. When she's not writing or editing,...